Correlation vs. Causation
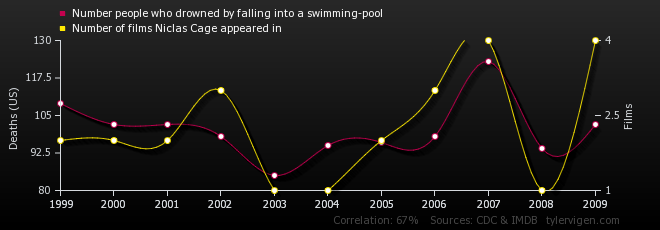
When doing research, it is important to establish causation, not just correlation. It is easy to show that one thing correlates with another, but that does necessarily mean that it causes something. For example, the graph below shows a strong correlation between “people who drowned by falling into a swimming pool” and the “number of films Nicolas Cage appeared in” across twenty years. However, it obvious Nicolas Cage films do not cause people to drown in pools or vice versa. This means that while there is a correlation, there is no causation.
Often in science, it can be hard to prove what thing causes the other. In statistics, this is called the Endogeneity Problem, otherwise known as the chicken and the egg problem. In order for research to make real life impacts, we want to figure out which factor causes what so that we can put that knowledge to good use.
To do this scientists can use several statistical tools to get around this issue. One of those tools is to use an instrumental variable.
Solving the Endogeneity Problem
Please don’t be scared by this math-y thing, it will make sense. As we go through the process of solving the problem, this will be final image – we will build it as we go, so hang on….
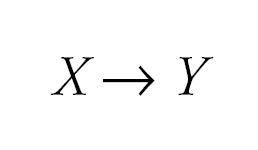
When designing an experiment, most of the time, the research question is asking “how does x affect y?” It can be visualized like this:
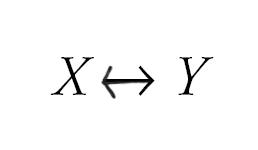
However, when we have the chicken and the egg problem, called the Endogeneity Problem, we can’t be sure which way the arrow goes. Does x cause y, or does y cause x? Is there correlation or causation? When this happens, we can visualize it like this:
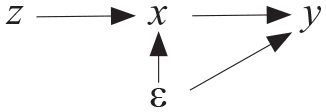
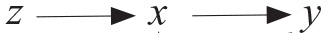
In order to solve this, we start by using an instrumental variable, which we will call z. Whatever z is, the scientists set it up so that z has an effect on x but DOES NOT have an effect on y. An example in the context of protests and success is rainfall. Imagine protests is x and success is y. When it rains, less people show up to protests, this has been proven many times. But when it rains, theres no reason why it would effect how many or what kind or polices are passed. This means rain, z, affects protests, x, but not success, y. It can be visualized like this:
So now we have the instrumental variable. Scientists use the relationship between z and x to create a predicted data set of x. This means it is not data taken from the real world, but data that is predicted from the relationship between z and x. In the rainfall example, we can use our knowledge of how rainfall affects the number of people who go out to protest to PREDICT how many people will show up, instead of literally counting how many people show up. This predicted data is called ε. We then would then study the relationship between ε and y to determine if one causes the other. By using ε instead of x, we know which way the arrow it pointing, solving the chicken and egg problem. The final visualization looks like this:

Using the relationship between z and x, we predict ε. Then we use ε to study y. This make sure the arrow is only going in one direction, and allows the results of the experiment to determine in what way x causes y.
YAY YOU DID IT
Leave a Reply